GDB JIT Interface 101
LLVM’s JIT libraries allow to link and load static build artifacts at runtime. We can play with object files in a JIT session without having to link them into a static executable. That’s great — as long as everything works as expected.
If something goes wrong, we face a little extra effort to inspect our code with a debugger. Mainstream debuggers scan executable and shared library files on disk to collect their symbols and debug info. And they know how to intercept shared library events like dlopen() and dlclose(). When we compile and link code in-memory, however, and load it on the fly, there is not much they can do. In order to debug such code we have to collaborate.
There is a surprising amount of things that can go wrong when debugging JITed code. This article explains debug info registration at runtime and tries to give assistance on what to check when things go south.
GDB JIT Interface
In 2009 GDB introduced an ingenious way for executables to register new code at runtime: JIT Compilation Interface docs. It’s kind of a loose standard with a single version so far. Other debuggers like LLDB picked it up later on. The interface relies on two symbols:
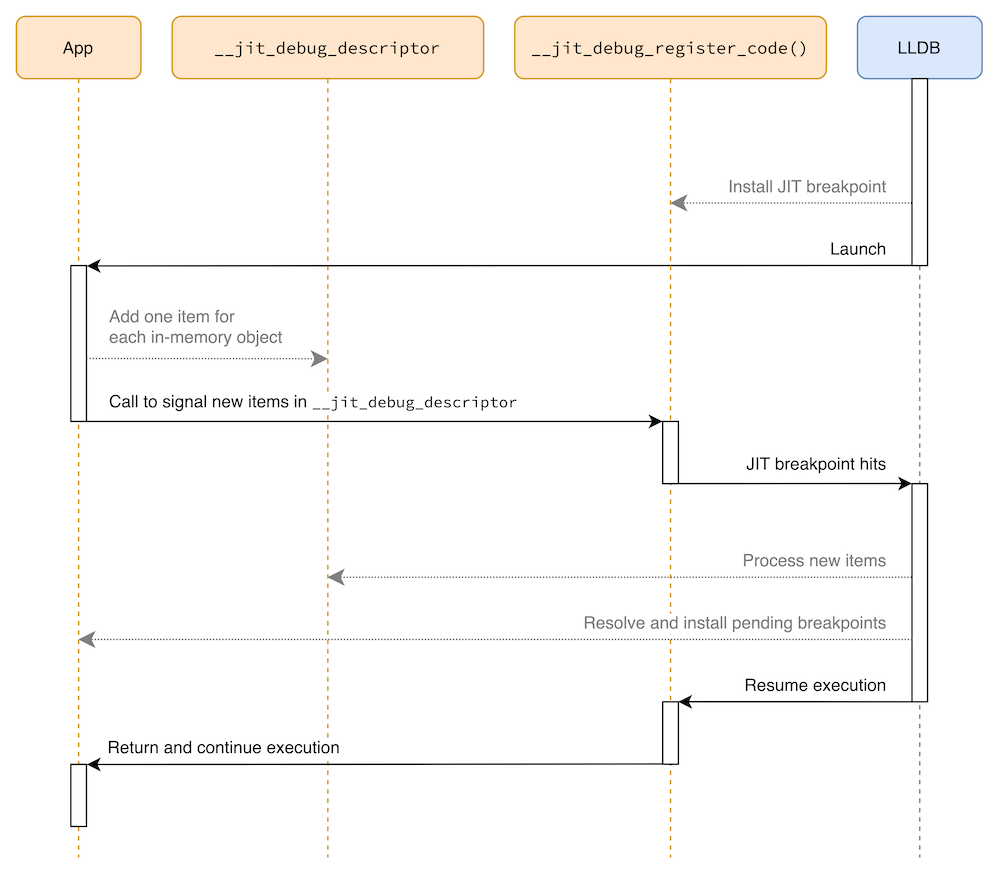
__jit_debug_descriptorhas typejit_descriptorand implements a linked list ofjit_code_entryitems. Our program adds items here for any new code that the debugger should know about.__jit_debug_register_codeis an empty function that our program calls in order to signal the debugger to process new list items.
Debuggers that implement the interface apply special handling for those symbols. At launch they check for the __jit_debug_register_code symbol and set a breakpoint that triggers the JIT registration hook: When it hits, the debugger walks the list in __jit_debug_descriptor for new items, reads them from process memory and extracts debug info.
An application that uses the interface will add new items to the __jit_debug_descriptor list whenever it emits new code. Each such item refers to an in-memory object file. Once the list is up to date, the application calls its own __jit_debug_register_code knowing that a debugger might interrupt execution and process the debug sections of the in-memory objects.
There was an attempt to add a more advanced JIT interface in GDB that involves GDB-side plugins, but the approach didn’t gain enough momentum as it seems (given that even V8 still uses the original interface).
LLDB Support
In 2014 LLDB gained an initial implementation for the GDB JIT interface which was first released as part of LLDB 3.5. However, the feature silently broke during the 6.0 development cycle since we had no good test for it. I managed to fix it a little later with two patches: The original registration bug in 2019 and source-level debugging in 2020.
LLDB fully supports the GDB JIT interface for ELF object files again since release 12.
LLVM JIT support
At the time of writing, LLVM comes with two different JIT-linker implementations: RuntimeDyLD and JITLink. RuntimeDyLD was designed as a dynamic loader for LLVM’s monolithic MCJIT implementation. As it grew into a fully fledged cross-platform JIT-linker, it surpassed the limits of its architecture and became increasingly harder to maintain and extend (for different code models, EH registration, TLS support, etc.). With the rise of LLVM’s composable ORC JIT libraries, JITLink came up as a replacement for RuntimeDyLD and today it is set to become the default JIT-linker for most LLVM target platforms.
RuntimeDyLD provides a JITEventListener interface for clients to run actions when new code is loaded or unloaded. Debug object registration is implemented in the GDBRegistrationListener. JITLink provides a much more comprehensive plugin interface, which allows to hook into the linking process at various stages. In early 2021, I implemented a simple DebugObjectManagerPlugin for JITLink that works for ELF objects in both cases, in-process and out-of-process JITing. Later that year the GDBJITDebugInfoRegistrationPlugin for MachO support landed upstream.
In-memory object files
The LLVM JIT libraries work with position-independent code. In principle, relocations for in-memory objects can be resolved on either side, the JIT or the debugger. It appears reasonable, however, to leave it to the debugger, because debug sections contain loads of relocations and the debugger can defer the task until it eventually needs to access the data. In order to resolve relocations, the debugger must know the load address in target memory for each allocated section. For that purpose the DebugObjectManagerPlugin collects section load addresses at link-time and writes them to the sh_addr field in the respective section headers (and leaves the object untouched otherwise).
Troubleshooting
There is a surprising amount of things that can go wrong when debugging JITed code. In order to check what we can do in such cases, we will use a minimal test executable to compare results against:
#include "stdint.h"

struct jit_descriptor {
  uint32_t version;
  uint32_t action_flag;
  void *relevant_entry;
  void *first_entry;
};

// External global symbol for debuggers to obtain debug info at runtime.
struct jit_descriptor __jit_debug_descriptor = {1, 0, nullptr, nullptr};

// Debuggers put a special breakpoint in this function. The noinline and the asm
// prevent calls to this function from being optimized out.
__attribute__((noinline)) void __jit_debug_register_code() {
  asm volatile("" ::: "memory");
}

int main() {
  __jit_debug_register_code(); // Trap into the debugger's JIT registration
  return 0;
}
1. Are we running LLDB version 12+?
Check the version and upgrade to a more recent one if necessary:
> lldb --version
lldb version 15.0.2
> lldb
(lldb) version
lldb version 15.0.2
2. Does our platform disable the JIT debug hook by default?
Apple platforms prefer to disable the JIT debug hook in LLDB by default, while everyone else wants to have it default enabled. As a compromise the setting is now platform-dependent and reading it doesn’t tell us anything:
(lldb) settings show plugin.jit-loader.gdb.enable
plugin.jit-loader.gdb.enable (enum) = default
In case of uncertainty turn it on explicitly:
(lldb) settings set plugin.jit-loader.gdb.enable on
(lldb) settings show plugin.jit-loader.gdb.enable
plugin.jit-loader.gdb.enable (enum) = on
3. Print logs from the JIT category to see what’s going on
Dump status info for important steps. For our demo executable, the output should look like this:
(lldb) b main
(lldb) log enable lldb jit
(lldb) r
lldb-15          JITLoaderGDB::SetJITBreakpoint looking for JIT register hook
lldb-15          JITLoaderGDB::SetJITBreakpoint looking for JIT register hook
lldb-15          JITLoaderGDB::SetJITBreakpoint looking for JIT register hook
lldb-15          JITLoaderGDB::SetJITBreakpoint setting JIT breakpoint
Process 2363705 launched: '/path/to/test' (x86_64)
Process 2363705 stopped
* thread #1, name = 'test', stop reason = breakpoint 1.1
    frame #0: 0x000055555555514f test`main at test.cpp:51:3
   48   } // extern "C"
   49
   50   int main() {
-> 51     __jit_debug_register_code();
   52     return 0;
   53   }
(lldb) n
intern-state     JITLoaderGDB::JITDebugBreakpointHit hit JIT breakpoint
Process 2363705 stopped
* thread #1, name = 'test', stop reason = step over
    frame #0: 0x0000555555555154 test`main at test.cpp:52:3
   49
   50   int main() {
   51     __jit_debug_register_code();
-> 52     return 0;
   53   }
(lldb) c
Process 2363705 resuming
Process 2363705 exited with status = 0 (0x00000000)
4. Can LLDB see our JIT interface symbols?
For our demo executable, the symbols are in the symbol table of the binary:
> nm test | grep __jit_debug_
0000000000004028 D __jit_debug_descriptor
0000000000001130 T __jit_debug_register_code
In LLDB we can look it up right away:
(lldb) target create "test"
Current executable set to '/path/to/test' (x86_64).
(lldb) image lookup -s __jit_debug_descriptor
1 symbols match '__jit_debug_descriptor' in /path/to/test:
        Address: test[0x0000000000004028] (test.PT_LOAD[3]..data + 16)
        Summary: __jit_debug_descriptor
(lldb) image lookup -s __jit_debug_register_code
1 symbols match '__jit_debug_register_code' in /path/to/test:
        Address: test[0x0000000000001130] (test.PT_LOAD[1]..text + 240)
        Summary: test`::__jit_debug_register_code() at test.cpp:40
It’s not always as easy though! Looking at lli from the official LLVM 15 release, the symbols are in the LLVM shared library that lli links against! This is why we won’t find them in LLDB before the executable launched and actually resolved its load-time libraries:
> lldb-15 -- lli-15
(lldb) target create "lli-15"
Current executable set to '/usr/bin/lli-15' (x86_64).
(lldb) image lookup -s __jit_debug_descriptor
(lldb) image lookup -s __jit_debug_register_code
(lldb) b main
Breakpoint 1: where = lli-15`main, address = 0x00000000000169c0
(lldb) r
Process 2364389 launched: '/usr/bin/lli-15' (x86_64)
Process 2364389 stopped
* thread #1, name = 'lli-15', stop reason = breakpoint 1.1
    frame #0: 0x000055555556a9c0 lli-15`main
lli-15`main:
->  0x55555556a9c0 <+0>: push   rbp
    0x55555556a9c1 <+1>: push   r15
    0x55555556a9c3 <+3>: push   r14
    0x55555556a9c5 <+5>: push   r13
(lldb) image lookup -s __jit_debug_descriptor
1 symbols match '__jit_debug_descriptor' in /usr/lib/llvm-15/lib/libLLVM-15.so.1:
        Address: libLLVM-15.so.1[0x0000000006f0e1f8] (libLLVM-15.so.1.PT_LOAD[1]..data + 255592)
        Summary: __jit_debug_descriptor
(lldb) image lookup -s __jit_debug_register_code
1 symbols match '__jit_debug_register_code' in /usr/lib/llvm-15/lib/libLLVM-15.so.1:
        Address: libLLVM-15.so.1[0x0000000002a54420] (libLLVM-15.so.1.PT_LOAD[0]..text + 30459296)
        Summary: libLLVM-15.so.1`__jit_debug_register_code
Moreover shared libraries contain “undefined” U records for external symbols and this triggered a bug in LLDB’s JITLoaderGDB. If we linked against such a shared library and LLDB encountered it before the one with the actual definition, LLDB failed to resolve __jit_debug_register_code. The issue should be fixed in the upcoming LLDB release 16. We can stop in main() and lookup the symbol manually to check for this case, e.g. in a BUILD_SHARED_LIBS build of mainline LLVM:
> lldb-15 -- /path/to/llvm-project/build/bin/lli
(lldb) b main
(lldb) run --version
(lldb) image lookup -s __jit_debug_register_code
1 symbols match '__jit_debug_register_code' in /path/to/llvm-project/build/lib/libLLVMExecutionEngine.so.16git:
        Name: __jit_debug_register_code
        Value: 0x0000000000000000

1 symbols match '__jit_debug_register_code' in /path/to/llvm-project/build/lib/libLLVMOrcTargetProcess.so.16git:
        Address: libLLVMOrcTargetProcess.so.16git[0x000000000000fa5a] (libLLVMOrcTargetProcess.so.16git.PT_LOAD[1]..text + 20058)
        Summary: libLLVMOrcTargetProcess.so.16git`__jit_debug_register_code
6. Does our JITed code contain debug info?
We can check for DI meta data in LLVM IR code and for debug sections in object files:
> clang -S -emit-llvm -g -o - test_foo.c | grep "\!DI" | wc -l
9
> clang -S -emit-llvm -o - test_foo.c | grep "\!DI" | wc -l
0
> clang -c -g -o - test_foo.c | llvm-objdump -h - | grep debug | wc -l
11
> clang -c -o - test_foo.c | llvm-objdump -h - | grep debug | wc -l
0
We can break on both, functions and source locations if we have debug info. Otherwise we can only break on functions and only get disassembly:
 1 location added to breakpoint 1
 Process 1625659 stopped
 * thread #1, name = 'lli', stop reason = breakpoint 1.1
-    frame #0: 0x00007ffff70d0004 JIT(0x56e4e0)`foo
-JIT(0x56e4e0)`foo:
-->  0x7ffff70d1000 <+0>: mov    eax, 0x2a
-    0x7ffff70d1005 <+5>: ret
-    0x7ffff70d1006:      add    byte ptr [rax], al
-    0x7ffff70d1008:      add    byte ptr [rax], al
+    frame #0: 0x00007ffff70d0004 JIT(0x56e4e0)`foo at test_foo.c:4:10
+   1    static int some_value = 42;
+   2
+   3    int foo() {
+-> 4      return some_value;
+   5    }
7. Does LLVM OrcJIT support debugging for your platform?
As of 2022 the DebugObjectManagerPlugin covers ELF on all matching platforms. (I never tested it outside of 64-bit x86 systems but it might actually work!) There are upstream tests in LLVM and LLDB and the plugin is wired up in both tools, lli and llvm-jitlink. There is an example for debugging out-of-process and a test for it upstream.
The GDBJITDebugInfoRegistrationPlugin implements debug support for MachO on Apple systems. Right now it doesn’t appear to get tested and it’s only wired up in llvm-jitlink.