Debugging llvm-lit in vscode
The LLVM Integrated Tester llvm-lit provides the test infrastructure for LLVM and its subprojects. It features automatic test exploration, fine-grained hierarchical configration and a flexible notation for RUN and CHECK lines (in combination with FileCheck). LIT also exists as a standalone package. If you are looking for a tool to run input/output tests, it’s certainly worth considering LIT.
All in all LIT consists of a pretty complex mix of Python modules and configuration scripts that makes it a little tricky to debug. Especially, for those who use Python only occasionally. The way it works best for me is to run LIT standalone from the command line with debugpy and then attach the Visual Studio Code (vscode) debugger to it.
In the following I assume that you have a LLVM build at hand and installed vscode, Python3 and the official Python plugin. The only thing we still need is the debugpy package from pip:
> apt install python3-pip
> pip3 install debugpy
Now navigate to your LLVM build root and run the LIT driver with debugpy. The extra --wait-for-client argument will cause Python to defer execution until we connect a debugger:
> cd /path/to/llvm-build
> python3 -m debugpy --listen localhost:5678 --wait-for-client bin/llvm-lit
Next, open vscode, create a launch.json and add a Python debug configuration. The default settings of the Remote attach template should do:
{
  "name": "Python: Remote Attach",
  "type": "python",
  "request": "attach",
  "connect": {
    "host": "localhost",
    "port": 5678
  },
  "pathMappings": [
    {
      "localRoot": "${workspaceFolder}",
      "remoteRoot": "${workspaceFolder}"
    }
  ]
}
Launching this configuration triggers the Python process to run the test suite. If a test fails, execution gets interrupted with an exception and vscode points you to the code location. In all LIT modules and scripts with a .py file extension you can now set breakpoints as usual.
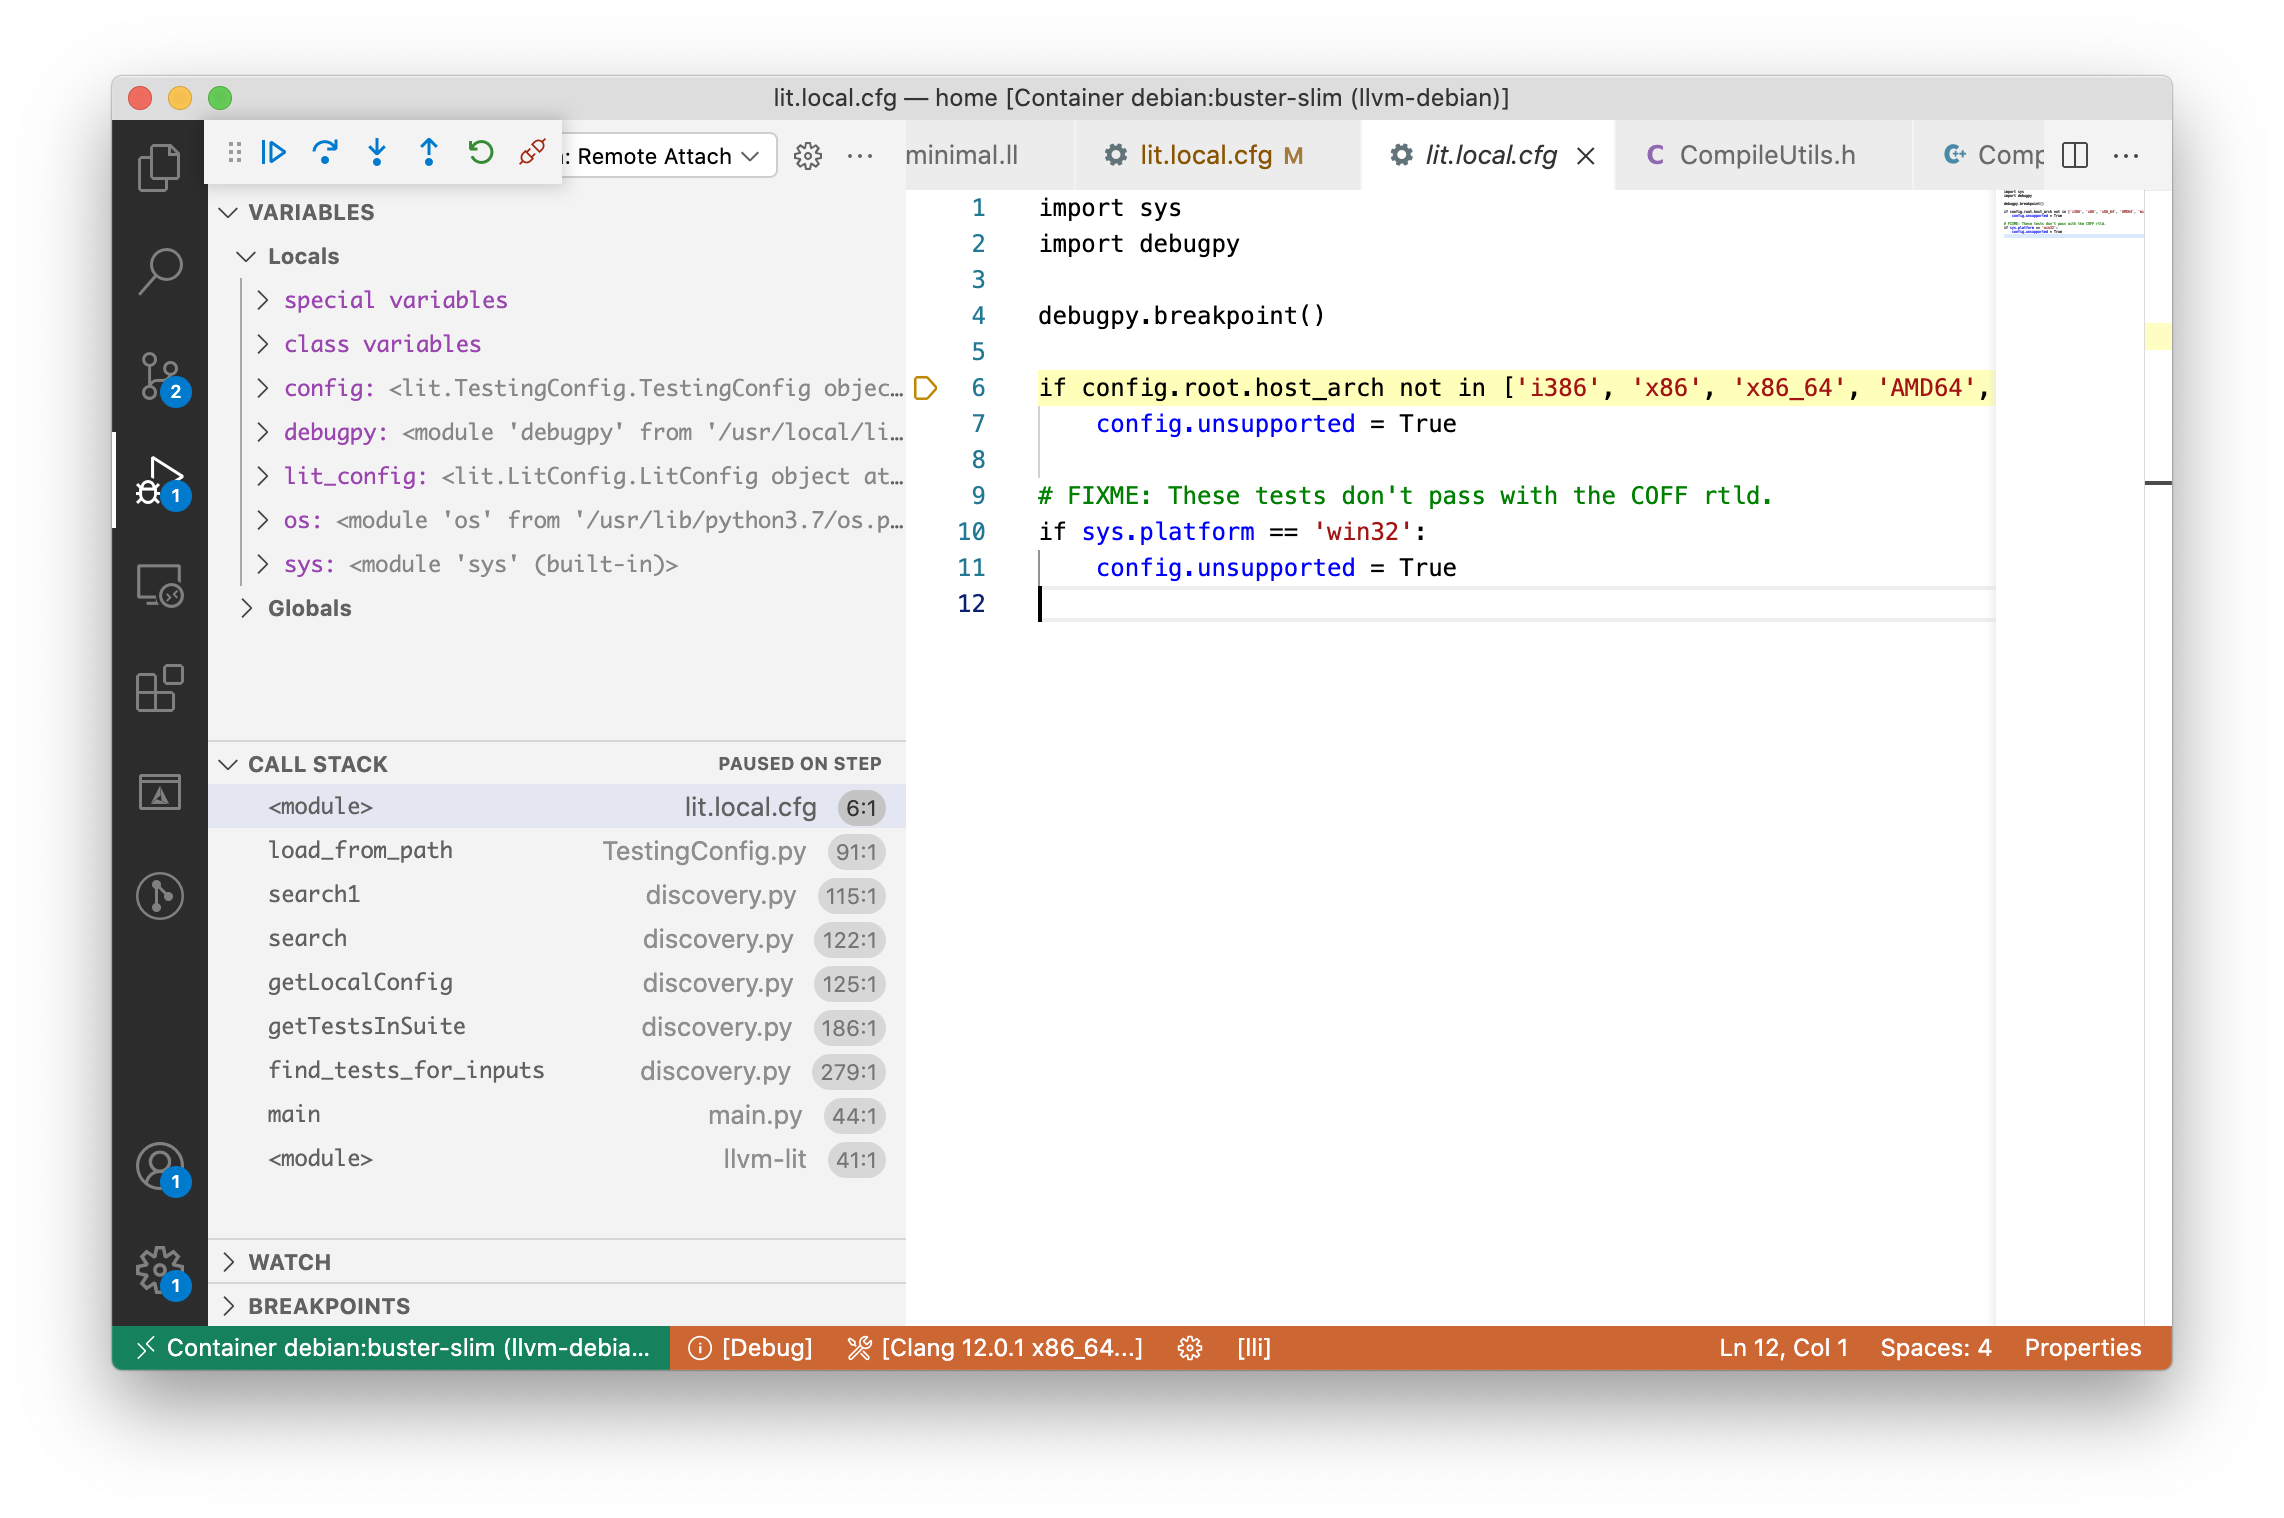
However, a lot of configuration scripts in LLVM still have no .py extension. Instead they are interpreted as Python code only through exec() commands from the driver. vscode won’t let you set breakpoints here. This is where the explicit breakpoint feature in debugpy comes handy! Just add these two lines in your lit.local.cfg file:
import debugpy
debugpy.breakpoint()
Execution will be interrupted at the subsequent line during test exploration and voila, you can properly debug your configuration script.
Recent versions of LIT started forking child processes, but AFAIK no Python debugger supports a follow-fork feature like GDB or LLDB. Since it won’t forward our --listen and --wait-for-client parameters to the child processes, our breakpoints won’t hit there. We cannot change that without touching the implementation of LIT, but we can still debug these cases. Just add the debugpy remote debug configuration in the location of our first breakpoint:
import debugpy
if not debugpy.is_client_connected():
    debugpy.listen(("localhost", 5678))
    debugpy.wait_for_client()
debugpy.breakpoint()